Located in the north-eastern border of Ghana, Paga is a sacred crocodile sanctuary. Although crocodiles are considered as wild creatures, the Paga crocodiles are friendly and coexist with humans.
The friendly relationship between the crocodiles and humans continue to baffle the minds of many. This is in contrast to the perception of crocodiles as dangerous.
It is a customary offence to harm, kill or show any sign of disrespect to the crocodile of Paga. It is common to find children and or visitors sitting at the back of or holding the tale of a crocodile without any harm, after a sacrifice of a chicken.
According to the villagers, the crocodiles have never harmed anyone but since there's a first time for everything, a hospital is located 200 km to the south in the capital city of northern Ghana, Tamale.
This is normal for the people of Paga but a mystery to visitors.
The U.N. estimates that the world`s population will pass the 7 billion mark today. That`s a whole lotta people. Much of that growth has happened in Asia — in India and China.
This video does an excellent job of explaining how population growth has happened with beautiful visualizations. Click through to watch it. It's worth it.
We all know consumers spend more during the holiday season than any other time during the year. But did you know 38% of people have already began their yearly shopping extravaganzas?
Online shopping now beats out shopping in stores (for the social media users who responded to the survey) and electronics are at the top of their shopping lists. Seventy-two percent get gift ideas from Facebook, the most popular social network for researching.
The infographic, created by Lab42, also includes some interesting stats, such as the average shopper in 2010 spent $107.50 on themselves. Thirty-one percent of people will spend over $700 this year.
Lab42′s data comes from an online survey of 545 social media users between Oct. 18 and Oct. 20.
In celebration of Halloween, the front page of Google is featuring a time-lapse Google Doodle animation of their logo being cared out of giant pumpkins on the lawn of the Google campus in Mountain View, CA.
Youtube user Respect the Pact have created a video featuring a real life Pac-Man who realizes he's a walking video game and can subsist on pac-dots. Lucky! The ghostly Blinky, Pinky, Inky and Clyde make appearances and give him a good chase through suburbia. Enjoy.
For many organizations, power and growth come from the idea of having lots of customers and even more potential customers. Lots of eggs, lots of baskets.
When one gets annoyed or leaves for a lower price or goes out of business, no big deal, there's always more where he came from. Believing you have an abundance of alternatives means that you can mistreat, ignore or reject any individual if you like. Or make something that merely delights a few, instead of all.
Even a frequent flyer with 100,000 miles on his account is disposable when you have millions of them.
For a few organizations, the opposite is true. One basket, cared for and watched carefully. When no one else can focus on and serve that customer as well as you (because you have no choice, it's your only basket) you have a huge obligation but you also have a platform to do great work.
About a year ago, we started talking about how we wanted to find a way to meet more people from the community in person. Sure we all get to know each other online through the blog, on Twitter or maybe in Q&A, but it's nothing like getting to meet people face-to-face. There becomes a bond or friendship once you actually know each other that helps to build a community.
The idea we came up with was MozCation. We asked our community to create some sort of unique content and tell us why we should have an SEOmoz Meetup (aka MozCation) in their city. The plan was to pick one city based on the uniqueness of the submission, number of people involved (tweeting, promoting, commenting, etc.) and the actual location. Well we were in for quite the treat after we introduced the idea of MozCation, and people all over the world began nominating their cities.
As many of you know, we had a really tough time choosing just one... and chose four instead. :) But this meant organizing four events including venue, speakers, food, drinks, and about a million other tasks that goes along with a meetup like this. What we weren't quite prepared for was that three out of the four cities were international, which meant we also had to figure out shipping and visas and all that fun stuff.
We've just wrapped up our last one and I wanted to give a quick overview of each and link to each of the speaker presentations. We had an amazing lineup of speakers from Salt Lake City to Barcelona and we'd love to share that knowledge with all of you. Take a peak below at the awesomeness that was MozCation 2011.
Salt Lake City - June 29, 2011
Our first stop on the MozCation tour was Salt Lake City, Utah. We also only had about 3 weeks to get everything organized as we had already set the date. Yikes! Thanks to Elisabeth Osmeloski we found a great venue and were able to get it all done in the nick of time. Being our first one, we also learned quite a few valuable lessons that we changed for the next events. We were amazed by the turnout and it was a seriously packed house. The energy in the room was full of excitement and the speakers really brought their A-game.
At each event we had food, drinks and networking before and after the presentations. Not only did we want to meet the community but we wanted the local communities to get to know each other as well. It was great to see the way the Salt Lake City group began talking about getting together more often. Community rules!
Mozzers arrive for the first MozCation! Airport pics FTW
Whee! This was the second stop on the MozCation tour and what better place than to head to our first of two trips to South America. This meetup corresponded with the Brazilian conference Expon, so not only did we have lots of people from the local community there, but we had some great international speakers around as well. Also a huge shout out to Fabio Ricotta and his team for helping us to get everything organized.
MozCation means everyone works. Especially Rand :)
Hola Peru! Our third stop took us back to South America, but this time to Lima, Peru. One of the most exciting parts of this trip was that we had people from all over Latin America join us. When Lima was first nominated, we were seeing tweets from Argentina, Mexico, Costa Rica, and many other countries pledging their backing of Lima. It gave me chills of excitement to see how the community had rallied together in that way.
One thing we did differently in Peru is that we were able to have a live stream of the event. This made it possible for many people to tune in and enjoy the presentations even though they weren't there (I was one of those people). This was a huge success and we decided that we'd try to make that happen from then on.
This is now known around the office as the "MozCation Face"
Another packed house in Peru
The Lima event wouldn't have happened with out the special help from Daniel Falcon who not only helped us to organize the event but also was our translator during the presentations.
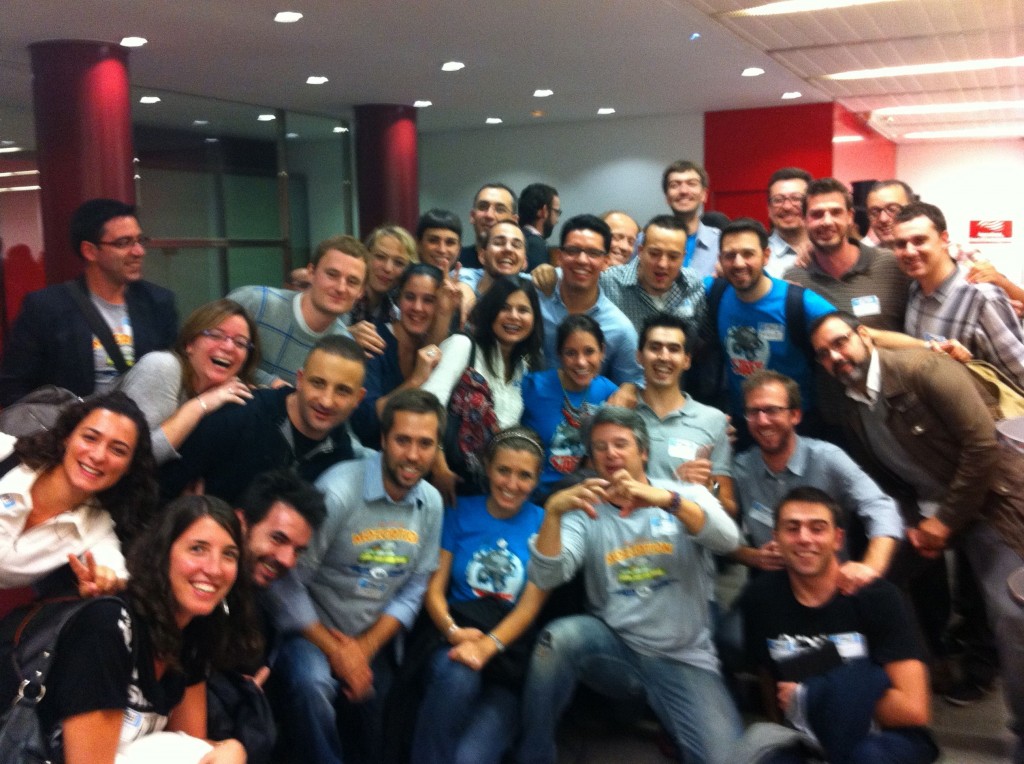
Although Barcelona was the last MozCation for the year, it certainly wasn't the least. In amazing Spanish style, the final event was a hit. Since we learned a bit more with each event we planned, Barcelona had it all. As with all of the MozCations, the speakers were top of the line. We were also lucky to have Miguel Pascual as the MC and he helped us to plan the event. Plus I have to give a shout out to Gianluca Fiorelli who quickly responded to my 500 emails about such little things as how we should organize the t-shirts. :)
Let the registration begin! All the attendees got a nametag, MozCation T-shirt and Roger sticker. Beep!
We owe a huge huge huge debt of gratitude to all of our speakers and everyone who attended these events. We were overwhelmed by the response and attendance, and are simply giddy about the community all over again. Plus we want to thank you all for the hospitality and generosity shown in every city we visited.
I also want to thank everyone at SEOmoz who helped make each of these possible during one of the craziest times of the year for us. Thank you, gracias and obrigado!
Please, if you have photos or blog posts or anything MozCation related, post it in the comments! Thanks :)
MozCation 2012
Don't worry, you'll get your chance to nominate your city next year. :) Just watch this space and we'll let you know when nominations are up again!
This post was originally in YOUmoz, and was promoted to the main blog because it provides great value and interest to our community. The author's views are entirely his or her own and may not reflect the views of SEOmoz, Inc.
As SEOs we often live in a bubble, sometimes it's a social media bubble where we only tweet amongst our peers, sometimes it's a literal bubble that we don't explore outside our comfort zone, but that bubble can easily keep us from seeing things that to consultants in other fields is painfully obvious. At the end of the day, an SEO consultant isn't any more special than a CPA or a Financial Planner, we're all consultants and ultimately our job is to give our clients what they want.
The question then is, what do our clients want?
Our clients want value, our clients want progress, and they're willing to invest in consultants to get what they want, but it falls to us to prove not just the value that we know exists in SEO and other Inbound Marketing tactics, but to also deliver the perception of value. Not only to our primary contact, but to their superiors and anyone else who might be reading the documents you leave behind.
I was talking with Tom Critchlow about this and he said something to me that I asked his permission to share here and I couldn't agree with him more. Tom said, "There's no good nailing value, if you don't nail perceived value."
He's absolutely right. Starting out as an SEO consultant, my every focus was on the value of SEO and I believed with all my heart that White Hat SEO was valuable, that our tactics would increase our client's revenue, that we had the answers to the recession's tough questions.
I set out, a one man operation at the time, to educate my local business community about SEO. I spoke at luncheons, attended more networking events than I did actual client work, and just "hustled" to steal the term from Gary Vaynerchuck.
Our company grew, we gained clients, Image Freedom as a brand started to develop, we were providing SEO but my salesmanship abilities were primarily responsible for creating that perceived value. Value that was not shown in my documentation or my reports. My documents sucked, our logo sucked, our analytics reports changed every other month. We were a mess, all strategy, no presentation.
Image Freedom completely lacked consistency, and while we were growing, we were hindered by our emphasis on SEO's ACTUAL value, which you and I know intimately as readers of SEOmoz and members of this community, but I wasn't doing a good enough job on the perceived value component.
In 2010 we hired Prologue Branding, a consulting duo who helped us develop a consistent brand message throughout all of our documents, a great new logo, conducted past and present client interviews, the works. They stripped us down to our core.
It wasn't an easy experience to embark upon. Client interviews, especially the interviews with clients we'd let down, or who I'd failed to help maintain that perception of value with. It was a painful but humbling experience that I recommend every entrepreneur experiences on at least an annual basis.
Through pain comes growth and I lost many nights of sleep re-developing documentation, research, reports, guides, and whatever I could to help me bring the perception of SEO that my clients took away from our meetings closer in line with the reality that SEO really was a fantastic tool for growing their business.
We used to provide PDF's of our research, our audits, print outs from Google Analytics (don't lie, you know you've done this) and basically weak leave behinds that were far from inspiring to our clients. They perceived disorganization, inconsistent brand messaging, and that just wasn't the message I wanted them to take away, but I was stuck in my craft, I was the SEO, I knew what they needed and if they could just accept that it all lived in my head and not on paper then we can get on with the work of creating this value.
I was dead wrong.
Perception is reality, and through my branding audit, through our rebirth as a team and as a company, we started delivering not just perceived value in presentations and workshops about SEO, our documentation expressed that value, our audits were professionally printed and spiral bound. The documents felt substantial to hold, they escaped the "unicorns and rainbows" theoretical hindrance that effects so many in the Social Media and SEO spaces and became documented plans, strategies, and it was hard to look at what we delivered without knowing that we had a plan and you were in the right hands to get your business to where you want it to be.
I've owned an Internet Marketing company for two years now. As a team, we've exceeded my every expectation but we've made our share of mistakes along the way. If I can pass on one piece of wisdom to my fellow Entrepreneurs, to my fellow SEOs, it's the need for expressing the perceived value of what you do, and not just your belief in the value of your trade.
You're on SEOmoz, you're educated about SEO, you're reading tips and tactics from the greatest SEOs I've had the pleasure to meet and learn from. What you do is valuable, and you can break out and be a success. You can grow your business into a brand to be proud of.
Just don't forget that perception is reality. As soon as we established the perceived value of what we did, our clients started investing more into SEO, our momentum started to snowball beyond what we had expected and we were able to deliver, without fail, not just the things we knew our clients needed, but also the things our clients wanted.
Realtime Google Analytics data inside a Google Doc—a panacea!
Don't believe me? Check out that screenshot below. In this blog post I'll show how you can do this yourself, and I've created an easy template to help get you started.
Google Analytics is my favorite analytics product. And it's only been getting better with the new interface, flow visualization, and multi-channel funnels. Google Analytics is still best game in town for the price (it's free)!
But, despite all the flexibility that Google Analytics offers, sometimes you want to access data in a spreadsheet and create a truly custom report. That's where the Google Analytics Data Feed API comes in.
This blog post is going to show you how to create a custom report by connecting a Google Spreadsheet directly with your data from Google Analytics. When data is available directly in a spreadsheet you're able to make interesting comparisons, create the dashboard of your dreams, or chart data however you'd like. And the only requirement is that you have Analytics setup for your website. I've created a simple Google Spreadsheet template that makes the whole thing easy.
Analytics geeks: hold onto your seats!
It all started with the Data Feed Query Explorer
(Those who want to start accessing data in Google Docs should jump right to the next section.)
Before we dive in, a little background. A few weeks ago I was looking for a solution to directly access Google Analytics data in Microsoft Excel or Google Docs using the Google Analytics API.
I first discovered Google's excellent Data Feed Query Explorer. The explorer lets you connect to your Analytics account and pull custom data until your heart's content. This tool is not only an efficient way to figure out what's available via the API, but it's also great for pulling custom data. Want to see which organic keywords drove conversions on your site? Enter the details as below, after authenticating and adding your appropriate profile ID:
The Data Feed Query Explorer is a great way to explore the Google Analytics API, and to understand what data is available. If you're interested in understanding the API, experiment with the tool but also check out the API documentation.
While this tool is helpful, it didn't meet my goal of accessing this data within a live spreadsheet such as Google Spreadsheets. Enter Mikael Thuneberg. Mikeal wrote an excellent set of scripts that pulls data from the Google Analytics API, and allows you to access that data within a Google Spreadsheet. Nice work, Mikeal. He provides this code free of charge (and it's included in my template below), but feel free to reach out to him if you're interested in paying an expert for your custom reporting needs.
I used Mikeal's scripts to create a template that accesses Google Analytics data and allows you to customize it in almost any way. Let's get started!
Connecting Google Analytics to Google Docs
I've created a brief screencast to walk you through connecting your Google Analytics account to the template I've created, but the instructions are also written out below the video. (A small disclaimer: this spreadsheet is provided without warranty or support, so please use at your own risk!)
1) Make sure you have a Google Analytics account with data. Duh.
Make sure you're logged into Google Analytics on the computer you'll be using with my spreadsheet template.
2) Open the spreadsheet template and save a copy.
Open this Google Spreadsheet template, and save a copy to your own Google Account (as you cannot edit this public version). Once the spreadsheet is open, choose "File"... "Make a copy".
Give the browser a few moments to make the duplicate copy. Once the copy is created, enter your Google Analytics username (usually an email address).
4) Enter your Google Analytics password.
Enter your Google Analytics password. Once entered, you may hide that row to obfuscate your password.
If the cell below the Profile ID shows an Auth Token (a very long alphanumeric string) you have successfully authenticated. If you have an issue, ensure you are logged into the same Google Account for which you are trying to access. If you still have any issues, such as a CAPCHA warning, wait 30 minutes and try again.
5) Enter your Google Analytics Profile ID.
You'll need to determine the Google Analytics Profile ID of the site you'd like to create a custom report for, and enter it into the Google Spreadsheet.
Log into GA (in a separate browser window) and open the profile for which you'd like to access data. Getting the profile ID isn't easy, and it differs based on which version of GA you use.
Once you're logged into Google Analytics, grab the profile ID from the browser address bar. Here's where you can find it depending which interface of Google Analytics you're using.
Finding your Profile ID in the Old Google Analytics Interface:
If you're using the old Google Analytics interface, your profile is highlighted below in yellow. In the example below it is 2917495 and should be entered into the spreadsheet as characters only.
Finding your Profile ID in the New Google Analytics Interface:
If you're using the new Google Analytics interface, your profile is highlighted below in yellow. In the example below it is 2917495 and should be entered into the spreadsheet as characters only.
Once you have the profile ID, add it to the appropriate field in the spreadsheet template. If everything worked, the cell below the Profile ID should display an Auth Token (a very long alphanumeric string). If you have any issues, ensure you are logged into the same Google Account for which you are trying to access. If you still have issues, such as a CAPTCHA warning, wait 30 minutes and try again.
6) Click the "Custom Report" tab to start accessing your data!
Now you're all set! Click on the "Custom Report" tab at the bottom of the Google Spreadsheet to start interacting with your data. Edit the cells in yellow to change what data is pulled, and for what data ranges. Read on to learn more about choosing which metrics to pull, and how to filter the data.
Customizing the data
When you jump into the "Custom Report" tab of the spreadsheet you'll notice several of the cells are yellow. You can update these cells to change what data is pulled from Google Analytics. For a full walkthrough of the spreadsheet template, be sure to watch the screencast earlier in this blog post.
There are four ways you can change the information that's pulled from Google Analytics into the spreadsheet.
Metric: Change which metric is pulled in that column of the spreadsheet—for example: visits, pageviews or bounces. Change this value and the cells below will update to pull that data. Check out Google's Dimensions & Metrics Reference for details on what data you can access.
Filter: Change how the data below is filtered, i.e. what data is included. Here you can specify a filter that will show only metrics for which the filter is true. For example, setting 'ga:medium==organic' in the filter cell will only show data where the traffic medium is organic search. The filter section is where you have a lot of power—you can even use regular expressions to do advanced filtering. To learn more about setting the filter cell, read Google's Data Feed documentation.
StartDate: Enter a date in the MM/DD/YYYY format to select the start date for cells in that particular row.
End Date: Enter a date in the MM/DD/YYYY format to select the end date for cells in that particular row.
How to make this actionable
So you've connected your Google Analytics account to a Google Spreadsheet. Now what? There's a lot you can do when you access your analytics in this format; I've included a few ideas below:
Put interesting metrics next to one another. Have you ever wanted to see your total visits next to your organic search visits and goals completions? By choosing the metrics that get displayed in each column you can compare metrics however you like.
Compare a variety of date ranges easily. Want to compare several days, weeks or months? Change the start and end dates and you can compare multiple periods.
Create advanced filters. Get creative with your filters. Try creating a filter for organic search traffic (ga:mediun==organic), or for a set of keywords using regular expressions. There are unlimited ways you can slice and dice your data!
Create calculated cells. Add a column to the spreadsheet and calculate your conversion rate by dividing your goal completions by your visits.
Create your ultimate dashboard. Probably the most useful way to use this report is to create a dashboard of your favorite key performance indicators. This spreadsheet can automate your weekly or monthly reporting by pulling all of the relevant metrics in one swoop!
These are just a few of the many ways you can use Google Analytics data within a spreadsheet. I'd love to hear your ideas for how to make this actionable—please let me know in the comments.
A few technical notes
The Google Analytics API is rate limited, so you may occasionally receive errors because your spreadsheet has made too many API calls at once. Unfortunately, there's no easy way around this expect to reduce the number of rows or columns of data you're pulling. Please let me know in the comments if you've found a good workaround for this.
Your password is in plaintext in the Setting tab of the spreadsheet. Be sure you don't share this Google Doc unless you want someone to have access to your Google Analytics password.
Be a data ninja!
I hope this template is useful and that you're now able to do all sorts of fancy things with your web analytics data. Please let me know how it works in the comments!


 The idea we came up with was MozCation. We asked our community to create some sort of unique content and