Posted by Trevor-Klein
Content marketers hear regularly about how quality is far more important than quantity. You can publish a thousand blog posts in a year, but if only three of them are truly noteworthy, valuable, and share-worthy content—what Rand would call 10x content—then you've wasted quite a bit of time.
Here at Moz, we've published blog posts on a daily cadence since before almost any of us can remember. If you didn't already know, Moz began as SEOmoz in 2004, and was little more than a blog where Rand fostered one of the earliest SEO communities. He offered a bit more background in a recent interview with Contently:
"It's a habit that we've had since 2004, when I started the blog. It's one of those things where I was writing every night. I think one of the big reasons that that worked so well in the pre-social-media era was because the Moz comments and the Moz blogs were like the Twitter or Facebook for our little communities."
We've taken occasional days off for major holidays when we knew the traffic volume wouldn't be there, but the guiding philosophy was that we published every day because that's what our audience expected. If we stepped back from that schedule, we'd lose our street cred, our reliability, and a sizeable chunk of our audience, not to mention the opportunities for increased traffic.
It's now quite easy to have those discussions on Twitter, Facebook, Quora, and other networks, making our old approach an outdated philosophy that was based more on fear of the unknown and a misguided assumption than on actual data.
This May and June, we decided to change that. We're raising the bar, and we want to show you why.
It started with a tweet:
The ensuing discussion piqued the interest of Joe Chernov and Ginny Soskey at HubSpot, as they wondered what effects it might have to publish more or less frequently. We decided to collaborate on a pair of experiments to find out.
The setup
The experiments were simple: Set a benchmark of two "normal" weeks, then adjust the publishing volumes on each blog to (roughly) half the normal cadence for two weeks and double the normal cadence for two weeks.

One thing we should note from the get-go: We were always sure that Whiteboard Friday would continue to be a weekly tradition, so we didn't alter the publishing schedule for those. This experiment altered the schedule from Monday-Thursday.
We closely monitored our blog traffic and engagement metrics, as well as subscriptions to our emailed blog newsletter. HubSpot ran their experiment first, allowing Moz to learn a few lessons from their experience before starting our own.
The results from HubSpot's experiment were also published today; make sure you take a look.
The results
We had several central questions going into this experiment, and hypotheses for how each one would come out. There are six parts, and they're laid out below as follows:
- Effects of increased/decreased volume on overall traffic
- Engagement thins as volume grows
- Subscription slowdown
- Community complaints/backlash
- Trading quantity for quality
Important note: We know this is non-scientific. These results are intended to be directional, not definitive, and our takeaways—while they represent our best attempts at progress—are by no means perfect. We want this to be an ongoing discussion, so please chime in with your ideas in the comments!
1. Effects of increased/decreased volume on overall traffic
Hypothesis
Publishing fewer posts each week will lead to a significant decrease in overall traffic to the blog. Publishing more posts each week will lead to a significant increase in overall traffic to the blog. These changes will be proportional to the decrease/increase in publishing volume.
Results
Let's get the high-level overview before we dive into details. Traffic on the Moz Blog can obviously vary quite a bit depending on the traffic, but all things considered, it's remarkably steady. Here are total daily unique pageviews to all pages on the blog so far in 2015:

Spikes and dips here and there, but we're able to pull a pretty good benchmark from that data. Here's what that benchmark looks like:
Average weekday uniques: | 38,620 |
Average weekly uniques: | 227,450 |
Now, here's the traffic from the four weeks leading up to the reduced/increased publishing frequency, as well as the two weeks at half-cadence and the two weeks at double-cadence (I've also included a line for the average of 38,620):

There's a bit of a difference. You can tell the traffic during half-cadence weeks was a little lower, and the traffic during double-cadence weeks appears a little higher. I'd take the numbers highlighted above in green over the ones in red any day of the week, but those curves show far smaller variation than we'd anticipated.
Here's a look at weekly numbers:

That makes the dip a little clearer, but it's hard to tell from that chart whether the loss in traffic is anything to be worried about.
Let's dive a bit deeper into the two testing periods and see if we can't pick apart something more interesting. You might notice from the above daily charts that the blog traffic follows a regular weekly pattern. It peaks on Tuesday and falls gradually throughout the rest of the week. That's characteristic of our audience, which finds less and less time to read the blog as the week goes on. We wanted to take that variability into account when looking at each day during the testing period, and the following chart does just that.
It plots the traffic during the tests as a percent deviation from the average traffic on any given day of the week. So, the four Tuesdays that passed during the test are compared to our average Tuesday traffic, the four Wednesdays to the average Wednesday, and so on. Let's take a look:

This is a more noteworthy difference. Dropping the publishing volume to half our normal cadence resulted in, on average, a 5.6% drop in unique pageviews from those daily averages.
That actually makes perfect sense when it's put in context. Somewhere around 10-15% of our blog traffic comes from the most recent week's worth of posts (the rest is to older posts). If we publish half as many posts in a given week, there are half as many new pages to view, so we might expect half as many unique pageviews to those newer posts.
That's pageviews, though. What about sessions? Are fewer people visiting the blog in the first place due to our reduced publishing volume? Let's find out:

That's a bit more palatable. We lost 2.9% of our sessions that included visits to the blog during a two-week period when we cut our publishing volume in half. That's close enough that, for a non-scientific study, we can pretty well call it negligible. The shift could easily have been caused by the particular pieces of content we published, not by the schedule on which we published them.
Another interesting thing to note about the chart showing deviations from daily averages: Doubling the publishing volume did, on average, absolutely nothing to the number of unique pageviews. The average increase in uniques from daily averages during the double-cadence period is just a bit over 3%. That suggests relative saturation; people don't have time to invest in reading more than one Moz Blog post each day. (I'm not surprised; I barely have time to read more than one Moz Blog post each day!) ;-)
It also emphasizes something we've known all along: Content marketing is a form of flywheel marketing. It takes quite a while to get it up to speed, but once it's spinning, its massive inertia means that it isn't easily affected by relatively small changes. It'll keep going even if you step back and just watch for a short while.
2. Engagement thins as volume grows
Hypothesis
The amount of total on-page engagement, in the form of thumbs up and comments on posts, will remain somewhat static, since people only have so much time. Reducing the blog frequency will cause engagement to approach saturation, and increasing the blog frequency will spread engagement more thinly.
Results
Moz's primary two engagement metrics are built into each page on our blog: thumbs up and comments. This one played out more or less to our expectations.
We can get a good sense for engagement with these posts by looking at our internal 1Metric data. We've iterated on this metric since we talked about it in this post, but the basic concept is still the same—it's a two-digit score calculated from several "ingredients," including metrics for traffic, on-page engagement, and social engagement.
Here's a peek at the data for the two testing periods, with the double-cadence period highlighted in green, and the half-cadence period highlighted in red.
| Publish Date | Post Title | 1Metric Score | Unique Pageviews |
| 25-Jun | How Google May Use Searcher, Usage, & Clickstream Behavior to Impact Rankings - Whiteboard Friday | 81 | 12,315 |
| 25-Jun | How to Rid Your Website of Six Common Google Analytics Headaches | 56 | 7,445 |
| 25-Jun | How to Build Links in Person | 36 | 5,045 |
| 24-Jun | What to See, Do, and More at MozCon 2015 in Seattle | 9 | 2,585 |
| 24-Jun | The Absolute Beginner's Guide to Google Analytics | 80 | 15,152 |
| 23-Jun | Why ccTLDs Should Not Be an Automatic Choice for International Websites | 11 | 2,259 |
| 23-Jun | Brainstorm and Execute Killer Content Ideas Your Audience Will Love | 38 | 5,365 |
| 22-Jun | The Alleged $7.5 Billion Fraud in Online Advertising | 85 | 44,212 |
| 19-Jun | How to Estimate the Total Volume and Value of Keywords in a Given Market or Niche - Whiteboard Friday | 78 | 15,258 |
| 18-Jun | The Colossus Update: Waking The Giant | 62 | 14,687 |
| 17-Jun | New Features in OSE's Spam Score & the Mozscape API | 10 | 1,901 |
| 17-Jun | How to Align Your Entire Company with Your Marketing Strategy | 44 | 7,312 |
| 16-Jun | Dissecting and Surviving Google's Local Snack Pack Results | 15 | 2,663 |
| 15-Jun | Can You Rank in Google Without Links? New Data Says Slim Chance | 81 | 15,909 |
| 15-Jun | Study: 300 Google Sitelinks Search Boxes - Triggers and Trip-Ups Analyzed | 23 | 3,207 |
| 14-Jun | How to Choose a PPC Agency | 14 | 2,947 |
| 12-Jun | Why We Can't Do Keyword Research Like It's 2010 - Whiteboard Friday | 90 | 22,010 |
| 11-Jun | Eliminate Duplicate Content in Faceted Navigation with Ajax/JSON/JQuery | 38 | 5,753 |
| 9-Jun | 5 Spreadsheet Tips for Manual Link Audits | 50 | 6,331 |
| 5-Jun | Should I Use Relative or Absolute URLs? - Whiteboard Friday | 79 | 15,225 |
| 3-Jun | How to Generate Content Ideas Using Buzzsumo (and APIs) | 50 | 10,486 |
| 1-Jun | Misuses of 4 Google Analytics Metrics Debunked | 51 | 9,847 |
The 1Metric scores for the half-cadence period (in red) average almost 60, suggesting those posts performed better overall than those during the double-cadence period, which averaged a 1Metric score of 45. We know the traffic was lower during the half-cadence weeks, which suggests engagement must have been significantly higher to result in those scores, and vice-versa for the double-cadence weeks.
Taking a look at our on-page engagement metrics, we see that play out quite clearly:

The number of thumbs up and comments stayed relatively level during the half-cadence period, and fell sharply when there were twice as many posts as usual.
We're incredibly lucky to have such an actively engaged community at Moz. The conversations that regularly happen in the comments—65 of them, on average—are easily one of my favorite parts of our site. We definitely have a "core" subset of our community that regularly takes the time to join in those discussions, and while the right post will tempt a far greater number of people to chime in, you can easily see patterns in the users who spend time in the comments. Those users, of course, only have a limited amount of time.
This is reflected in the data. When we published half as many posts, they still had time to comment on every one they wanted, so the number of comments left didn't diminish. Then, when we published twice the number of posts we normally do, they didn't spend twice as much time leaving comments; they were just pickier about which posts they commented on. The number of comments on each post stayed roughly the same.
The same goes for the thumbs.
3. Subscription slowdown
The Moz Blog is available via an email subscription through FeedPress, linked to from a few different places on the site:

We wondered, what would happen to those subscriptions during the half-cadence period?
Hypothesis
With fewer opportunities to impress people with the quality of the blog's content and earn a spot in their inboxes, subscriptions to the blog posts will drop significantly during the half-cadence period.
Results
As it turns out, there was minimal (if any) effect on email subscriptions. Check out the numbers for both periods below:

Here's a view that's a bit easier to digest, similar to the one for traffic in part 1 of this post. This shows daily deviations from the
average number of new email subscriptions we get (about 34/day):
 On the whole, this is a very uninteresting (and for that reason interesting!) result. Our subscription rate showed no noteworthy fluctuations during either of the two testing periods.
These numbers are based on the total number of subscribers, and with half as many emails going out during the half-cadence period, we can fairly confidently say that (since the total subscriber rate didn't change) we didn't get a decrease in unsubscribes during the half-cadence week, as we'd have seen an increase in the subscription rate. That's a good sign: If people were fatigued by our rate of new emails already, we'd likely see a reduction in that fatigue during the half-cadence weeks, leading to less churn. No such reduction happened, so we're comfortable continuing to send daily emails.
One important note is that we don't send multiple emails each day, so during the double-cadence period we were sending daily digests of multiple posts. (Were we to send more than one each day, we might have expected a significant rise in unsubscribes. That's something HubSpot was better able to track in their version of this experiment.)
This was another primary concern of ours: If we skipped days on the editorial calendar, and didn't publish a new post, would our community cry foul? Would we be failing to meet the expectations we'd developed among our readers?
Hypothesis
Having multiple days with no new post published in a relatively short period of time will lead to disappointment and outcry among the readership, which has grown to expect a new post every day.
Results
While we didn't proactively ask our community if they noticed, we were watching social traffic specifically for word of there not being a blog post on one or more of the days we skipped during the half-cadence period. We figured we'd find a bunch of "hey, what gives?" Our community team is great at monitoring social media for mentions—even those that don't specifically ping us with @Moz—and this is what we found:
A single post.
That's really it. Other than this one tweet—one that elicited a heartfelt "Awww!" from Roger—there wasn't a single peep from anyone. Crickets. This hypothesis couldn't be more busted.
We asked in our most recent reader survey how often people generally read the Moz Blog, and 17% of readers reported that they read it every day.

Even if we assume some statistical variance and that some of those responses were slight exaggerations of the truth (survey data is never squishy, right?), that's still a sizeable number of people who—in theory—
should have noticed we weren't publishing as much as we usually do. And yet, only one person had a reaction strong enough that they posted their thoughts in a place we could find them.
5. Trading quantity for quality
This is a far more subjective hypothesis—we can't even measure the results beyond our own opinions—but we found it quite interesting nonetheless.
Hypothesis
If we post fewer times per week, we'll have more time and be better able to focus on the quality of the posts we do publish. If we publish more frequently, the quality of each post will suffer.
Results
As nice an idea as this was, it turned out to be a bit backwards. Publishing fewer posts did leave us with more time, but we didn't end up using it to dive deeper into revisions of other posts or come up with additional feedback for our scheduled authors. The Moz Blog is written largely by authors outside our own company, and even though we had more time we could have used to recommend edits, the authors didn't have any more time than they otherwise would have, and it wouldn't have been fair for us to ask them for it anyway.
What we did do is spend more time on bigger, more innovative projects, and ended the two half-cadence weeks feeling significantly more productive.
We also noticed that part of the stress of an editorial calendar comes from the fact that an artificial schedule exists in the first place. Even with the reduction in volume, we felt significant pressure when a scheduled post wasn't quite where we wanted it to be by the time it was supposed to be finished.
Because we ended up spending our time elsewhere, our experiment didn't focus nearly as much on the comprehensiveness of the posts as the HubSpot experiment did. It ended up just being about volume and maintaining the quality bar for all the posts we published, regardless of their frequency.
Our productivity gains, though, made us begin to think even more carefully about where we were spending our time.
Wrapping up
With some basic data clearly showing us that a day without a blog post isn't the calamity we feared it may be, we've decided it's time to raise the bar.
When a post that's scheduled to be published on our blog just isn't quite where we think it ought to be, we'll no longer rush it through the editing process simply because of an artificial deadline. When a post falls through (that's just the life of an editorial calendar), we'll no longer scramble to find an option that's "good enough" to fill the spot. If we don't have a great replacement, we'll simply take the day off.
It's got us thinking hard about posts that provide truly great value—those 10x pieces of content that Rand mentioned in his Whiteboard Friday. Take a look at the traffic for Dr. Pete's post on title tags since it was published in March of 2014:

See all those tiny bumps of long-tail traffic? The post still consistently sees 3-4,000 uniques every week, and has just crossed over 300,000 all-time. That's somewhere between 60-100x a post we'd call just fine.
60-100x.
Now, there's just no way we can make every post garner that kind of traffic, but we can certainly take steps in that direction. If we published half as many posts, but they all performed more than twice as well, that's a net win for us even despite the fact that the better posts will generally continue bringing traffic for a while to come.
Does this mean you'll see fewer posts from Moz going forward? No. We might skip a day now and then, but rest assured that if we do, it'll just be because we didn't want to ask for your time until we thought we had something that was really worth it. =)
I'd love to hear what you all have to say in the comments, whether about methodology, takeaways, or suggestions for the future.
Sign up for The Moz Top 10, a semimonthly mailer updating you on the top ten hottest pieces of SEO news, tips, and rad links uncovered by the Moz team. Think of it as your exclusive digest of stuff you don't have time to hunt down but want to read!

Posted by David-Mihm
To all Moz Local fans in the UK, I'm excited to announce that your wait is over. As the sun rises "across the pond" this morning, Moz Local is officially live in the United Kingdom!
A bit of background
As many of you know, we released the US version of Moz Local in March 2014. After 12 months of terrific growth in the US, and a boatload of technical improvements and feature releases--especially for Enterprise customers--we released the Check Listing feature for a limited set of partner search engines and directories in the UK in April of this year.
Over 20,000 of you have checked your listings (or your clients' listings) in the last 3-1/2 months. Those lookups have helped us refine and improve the background technology immensely (more on that below). We've been just as eager to release the fully-featured product as you've been to use it, and the technical pieces have finally fallen into place for us to do so.
How does it work?
The concept is the same as the US version of Moz Local: show you how accurately and completely your business is listed on the most important local search platforms and directories, and optimize and perfect as many of those business listings as we can on your behalf.
For customers specifically looking for you, accurate business listings are obviously important. For customers who might not know about you yet, they're also among the most important factors for ranking in local searches on Google. Basically, the more times Google sees your name, address, phone, and website listed the same way on quality local websites, the more trust they have in your business, and the higher you're likely to rank.
Moz Local is designed to help on both these fronts.
To use the product, you simply need to type a name and postcode at moz.com/local. We'll then show you a list of the closest matching listings we found. We prioritize verified listing information that we find on Google or Facebook, and selecting one of those verified listings means we'll be able to distribute it on your behalf.

Clicking on a result brings you to a full details report for that listing. We'll show you how accurate and complete your listings are now, and where they could be after using our product.

Clicking the tabs beneath the Listing Score graphic will show you some of the incompletions and inconsistencies that publishing your listing with Moz Local will address.

For customers with hundreds or thousands of locations, bulk upload is also available using a modified version of your data from Google My Business--feel free to e-mail enterpriselocal@moz.com for more details.
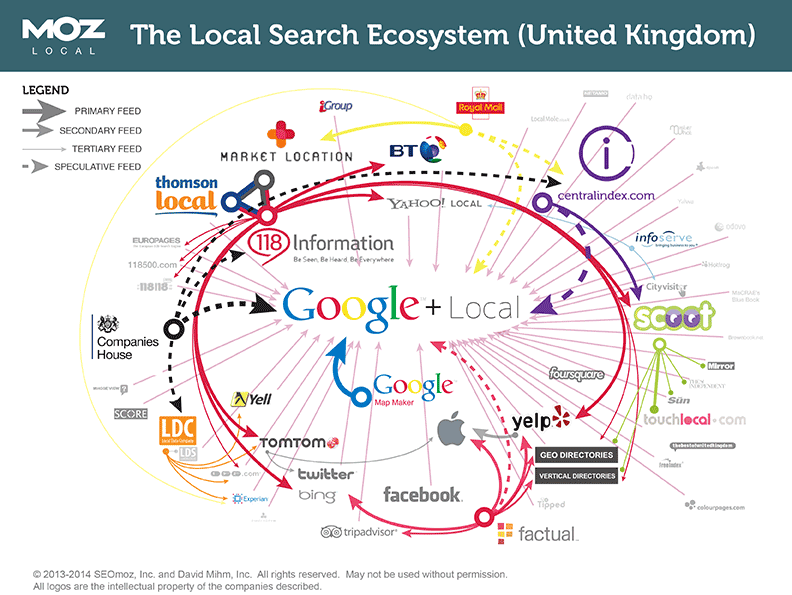
Where do we distribute your data?
We've prioritized the most important commercial sites in the UK local search ecosystem, and made them the centerpieces of Moz Local. We'll update your data directly on globally-important players Factual and Foursquare, and the UK-specific players CentralIndex, Thomson Local, and the Scoot network--which includes key directories like TouchLocal, The Independent, The Sun, The Mirror, The Daily Scotsman, and Wales Online.
We'll be adding two more major destinations shortly, and for those of you who sign up before that time, your listings will be automatically distributed to the additional destinations when the integrations are complete.
How much does it cost?
The cost per listing is £84/year, which includes distribution to the sites mentioned above with unlimited updates throughout the year, monitoring of your progress over time, geographically- focused reporting, and the ability to find and close duplicate listings right from your Moz Local dashboard--all the great upgrades that my colleague Noam Chitayat blogged about here.
What's next?
Well, as I mentioned just a couple paragraphs ago, we've got two additional destinations to which we'll be sending your data in very short order. Once those integrations are complete, we'll be just a few weeks away from releasing our biggest set of features since we launched. I look forward to sharing more about these features at BrightonSEO at the end of the summer!
For those of you around the world in Canada, Australia, and other countries, we know there's plenty of demand for Moz Local overseas, and we're working as quickly as we can to build additional relationships abroad. And to our friends in the UK, please let us know how we can continue to make the product even better!
Sign up for The Moz Top 10, a semimonthly mailer updating you on the top ten hottest pieces of SEO news, tips, and rad links uncovered by the Moz team. Think of it as your exclusive digest of stuff you don't have time to hunt down but want to read!

You are subscribed to the Moz Blog newsletter sent from 1100 Second Avenue, Seattle, WA 98101 United States
To stop receiving those e-mails, you can unsubscribe now. | Newsletter powered by FeedPress |


