
Google's "Multi-Week" Algorithm Update |
| Google's "Multi-Week" Algorithm Update Posted: 24 Jul 2013 08:00 PM PDT Posted by Dr-Pete Back on June 21st, Matt Cutts replied to a tweet about payday loan spam with an unusual bit of information (reported on Search Engine Roundtable): The exact timeline was a bit unclear, but Matt seemed to suggest a prolonged algorithm update covering as many as three weeks. Four days later, we tracked our highest temperature ever on MozCast, followed by more record highs: Seven days during the "multi-week" timeline showed temperature spikes near or above 90°, with six of those days exceeding the severity of the original Penguin update. Was It A MozCast Glitch?Let me perfectly honest â€" Google rankings are a moving target, and tracking day-to-day flux has proven difficult at best. Any given temperature on any given day is prone to error. However, this was a sustained pattern of very high numbers, and we have no evidence to suggest a glitch in the data. There were some reports that other tools were not showing similar spikes, but some of these reports were based on apples-to-oranges comparisons. For example, if you look at SERPmetrics flux data and isolate just page 1 of Google (which is what MozCast tracks), you'll see this: Sorry, it's a bit hard to see the dates on the reduced image, but the two spikes equate to roughly June 28th and July 4th, with a smaller bump on June 25th. While they're not an exact match, these two data sets are certainly telling a similar story.
Was It A Large-scale Test?This is a much harder question to answer. Our beta 10K data set showed similar patterns across multiple C-blocks of IPs, so we have no reason to believe this was specific to one or a very few data centers. What if Google made a massive change one day, though, and then reverted it? Theoretically, we would see two days of high MozCast temperatures, but if we looked at the two-day flux (instead of two one-day numbers), the temperature would be very low. While this multi-day flux is theoretically interesting, it can be very hard to interpret in practice. Some rankings naturally change, and Google can roll out multiple small updates in any given week. If we look at the overall flux between the start and end of recorded spikes (June 25 - July 4), we get a MozCast temperature of 120.3°, not much higher than the one-day temperature on June 27th. The average daily temperature for this period was 92.5°. Now, let's look at a similar time period (May 28 - June 6) â€" the average temperature for that period was 66.8°, and the multi-day temperature across the entire period was 114.7°. Comparing the two time periods, the overall flux for the period of record temperatures was roughly the same as the peak and about 30% higher than the multi-day average, whereas the overall flux for the quieter period was 72% higher than the average. This is an inexact science at best, and we don't have a good historical sense of multi-day patterns, but my gut feeling is that some of the multi-week update involved changes that Google tested and later rolled back. What About PMDs & EMDs?In my post on the June 25th temperature spike, I reported a noticeable single-day drop in partial-match domain (PMD) influence. That post happened very early in the multi-week update, so let's look at the PMD influence data across a 30-day time period that includes all of the high-temperature days: While there was a lot of movement during this period, you can see that PMDs recovered some of their initial losses around July 4th. The overall trend is downward, but the June 25th drop doesn't appear to have been permanent. It's interesting to note, even if not directly relevant to this analysis, that the long-term trend for PMD influence in our data is still decidedly downward. Here's a graph back to the beginning of 2013: So, how have EMDs fared? They seem to show a similar pattern, but in a much tighter range. Scaled to the same Y-axis as the PMD chart above, we get this: The EMD data is fairly consistent with Dr. Matt Peters' early report on our 2013 Ranking Factors study. Keep in mind that we are measuring two different things â€" the correlations show how well PMDs/EMDs ranked compared to other domains, whereas MozCast tracks how many PMDs/EMDs ranked across the data set. If the number of total PMDs drops, but they rank roughly as well, the correlations will remain stable, but the "PMD Influence" metric will drop. In other words, the correlations measure how well PMDs rank, whereas MozCast measures how many PMDs rank. Which PMDs Lost Long-term?There's one more question we can ask about the drop and subsequent recovery in PMD influence. Did the PMDs that fell out eventually come back, or were they replaced by different PMDs? The metric itself doesn't tell us, but we can dig deeper and see who lost out long-term. On the initial drop (between June 25-26), 62 PMDs fell out of our public 1K MozCast query set. New PMDs always enter the mix, so the net drop is smaller, but 62 PMDs that were ranking on June 25th weren't ranking on June 26th. So, let's compare that list of 62 to the data on July 5th â€" after the apparent recovery. On July 5th, 37 of those PMDs (60%) had returned to our data set. This certainly suggests some amount of legitimate recovery. So, which losing PMDs failed to recover? Here's the complete list (query keywords in parentheses):
It's not my goal to pass judgment on the quality of these domains, but simply to provide data for further analysis if anyone is interested. You can see that there are a few examples of multiple PMDs falling out of a single query, suggesting some kind of targeted action. How Did The Big 10 Do?In MozCast, we track a metric called the "Big 10" (I did my grad work at U. Iowa, so I should probably have thought twice about that name) â€" it's just a count of the total percentage of top 10 ranking positions held by the 10 most prominent sites on any given day. Those sites may change day-to-day, but tend to be fairly stable. Looking back to the beginning of 2013, we see a clear upward trend (this graph starts on January 8th, due to a counting issue we had with YouTube results at the beginning of the year):
The "Big 10" gained almost 2-1/2 percentage points in the first half of the year. Some of the gain across the year represents a shuffling of sites in the mix (Twitter falls in and out of the "Big 10", for example, and the root eBay domain struggled earlier this year), and some of this is a symptom of other changes. As Google gets more aggressive about spam, the sites that already dominate naturally tend to take more spots. I thought it would be interesting to look at these numbers alongside the year-to-date PMD and EMD numbers, but the "Big 10" doesn't seem to tell us much about the multi-week update. As a group, they moved only a fairly small amount between June 25th and July 5th (from 14.97% to 15.17%). Whatever Google tested and rolled out over this period, it didn't dramatically advantage big brands in our data set. What Happened, Then?Unfortunately, the patterns just aren't clear, and digging into individual queries that showed the most movement during the multi-week update didn't reveal any general insights. The volatility during this time period seems to have been real, and my best guess is that while some changes stuck, others were made and rolled back. Google may have been doing large-scale testing of algorithm tweaks and refining as they went, but at this point the exact nature of those changes is unclear. Between the multi-week update and Google's announcement of 10-day Panda roll-outs, it appears that we're going to see more prolonged updates. Whether this is to mitigate the impact of one-day updates or make the update process more opaque is anyone's guess. Sign up for The Moz Top 10, a semimonthly mailer updating you on the top ten hottest pieces of SEO news, tips, and rad links uncovered by the Moz team. Think of it as your exclusive digest of stuff you don't have time to hunt down but want to read! |
| Competitive Link Analysis: Link Intersect in Excel Posted: 24 Jul 2013 06:57 AM PDT Posted by mihai.aperghis This post was originally in YouMoz, and was promoted to the main blog because it provides great value and interest to our community. The author's views are entirely his or her own and may not reflect the views of Moz, Inc. Without a doubt, one of the main steps in creating an SEO strategy is the competitive analysis. Competitor backlinks can offer information on their link building strategies as well as giving you opportunities to strengthen your own link profile. These opportunities are hard to identify manually, especially in competitive niches, where websites tend to have a significant amount of backlinks. Although some tools do exist that can ease up this process, like the Moz Link Intersect tool, I chose to build my own tool using Excel that would offer greater flexibility in handling data. I wrote this guide to explain how you can build your own competitive link analysis in Excel, including a template to help you start right away. What can you find in this guide:
What Is Link Intersect Exactly?As you may know, the Moz Link Intersect tool (also known as the Competitive Link Research Tool or Competitive Link Finder), along with other tools of its kind, allowed you to find domains that link to your competitors but aren't linking to you. You can thus find lots of link opportunities, especially on the domains that link to more than one of your competitors, since there's a higher chance they might link to you as well. The Moz tool is currently unavailable, but I have it on good authority it will be back up down the road. The Excel version is somewhat the same thing, allowing you to view these domains, the competitors they are linking to, and from exactly which URL they link to them, in addition to other metrics that will help you decide which ones to contact. Why Would I Need the Excel Version?Here are the advantages of using the Excel version over other tools: First of all, most tools that include finding link opportunities from your competitors are part of a bigger platform that usually requires a monthly subscription. Excel is a one-time thing (though the backlink source is usually a monthly subscription platform itself), and chances are you might have it already. Second, if you have a small SEO business like I do (or are a freelancer) and can't really afford a developer to build your own tools yet, Excel might be one of the most useful software at your disposal. It's great for data analysis and visualization and has lots of nifty plugins that aid you in your day-to-day SEO job. Even more-so, almost every major online-marketing-related platform out there has the ability to export to Excel, giving you a centralized location of all the data. Third, the Excel version will allow you to:
Got It, Now Show Me the Magic!!OK, if you're still with me, I assume you're interested in this tool, so I'll take a step-by-step approach to explain how to create it. It does include a pivot table, but it's really not that hard to use and I'll use screenshots to show how to implement it. If you want to skip to the end result, the last chapter includes a template and instructions on how to use it. Tools of the TradeBefore we start the Excel-fu, here's a list of what you need to have at your disposal:
Step 1: Export Your Backlink Data (skip if you already know/have this)This is fairly basic. If you've used Excel for backlink analysis before, you probably already know how to do this. Personally I have a Moz PRO account, so I'll be using OSE for this step. Since I've just recently launched my company website, I won't be using it as an example. Also, since I am too lazy to pick a random website, I'm going to use seomoz.org as my primary domain. I'll choose 3 competitors (I mentioned you can choose as many as you want, but since these are fairly big websites, three should be enough for this example). These are: distilled.net, seerinteractive.com and seogadget.co.uk. Getting backlink data from each of those sites (including the primary one) is straightforward. Go to OSE, enter the domain and click search. Next, you will want to filter the results to include only external links to pages on the root domain or subdomain (the latter if the site's hosted on a subdomain that is fairly separate from the root domain, like a blogspot.com blog). IMPORTANT NOTE: Getting links to the root domain will usually get you more data, but will require the need of two additional formulas in step 3. Optionally, you can filter this more to only include dofollow links. Be sure to click the Filter button once you're done. Next, you'll want to download these links. Now, OSE gives you two options. Either use the "Download CSV" button and get up to 10k links, or use the Advanced Reports module where you have a daily credit limit and can export up to 100k links. In case you use that, you'll need to choose the "External linking page" and "Any page on this root domain" (or subdomain, accordingly) options. Everything else can be left as is, though you can choose to filter links with DA/PA higher than a certain value, to reduce the total number of results. Note that you can queue exports, so you don't have to wait for one to finish until you start the next one. You'll get emailed when they're done. Repeat this for all your competitors as well. In the end, we should have four different CSV files (one for our backlink data, three for the data of our competitors). Step 2: Import It Into Excel (skip if you've already done this and removed the errors)It's time now to open the magical software that our people refer to as Excel. To get the data from CSV files, we have two options:
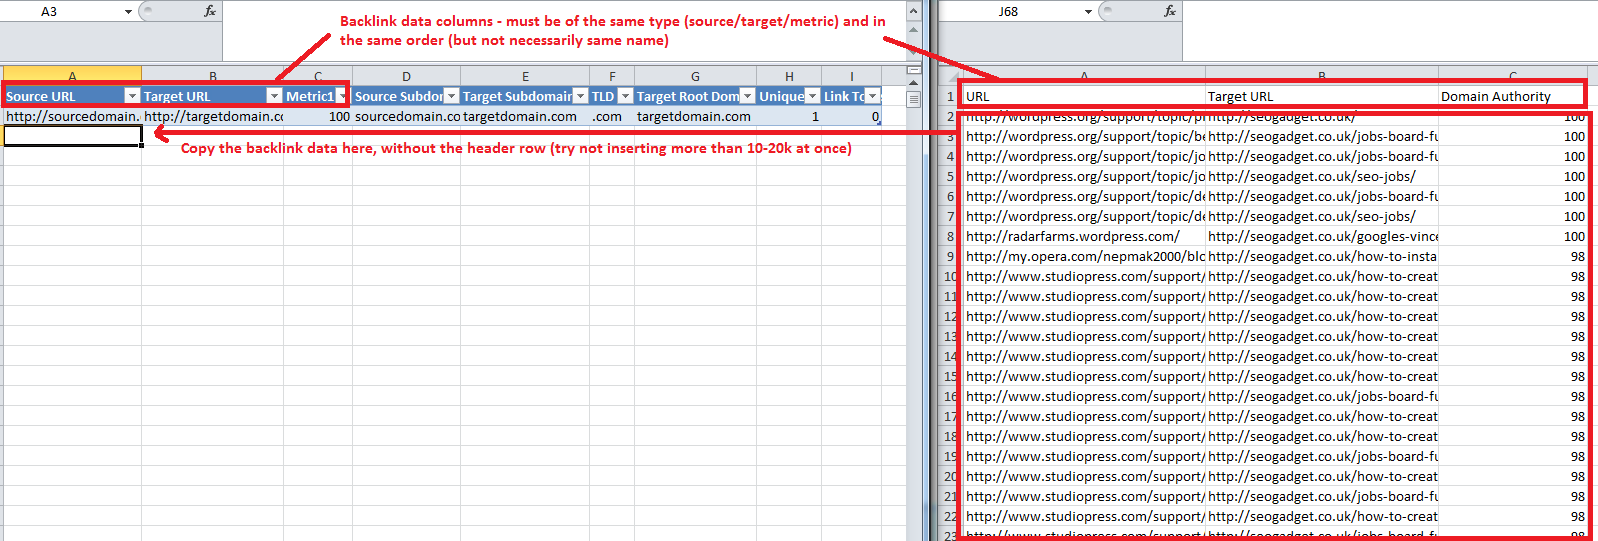
Both options are fairly simple, though the first one is easiest to do (won't even do screenshots for this). The problem is that the first option doesn't work if your Windows installation is set to a European country. That's because a CSV contains Comma-Separated Values, the comma being the default list delimiter in the US. For European countries, the default delimiter is usually the semicolon (";"), which means Excel won't read the CSV files correctly. To resolve this issue, you need to open the Regional and Language Options from the Control Panel in your Windows installation and either set it to English (United States), or keep your current country and, in the Advanced Settings, set the decimal symbol to dot (".") instead of comma, and the list delimiter to comma instead of the semicolon. You can view the exact process here (Solution #3): Alternatively, you can use the second option. The problem is, due to the way Excel imports data, some of it may be displayed erroneously, which would lead to some extra steps to clean up the data by removing all the errors. Due to this issue I decided not to include a tutorial on how to do this (but you can do it regardless if you prefer not to change your list delimiter). Regardless of your choice, after including data from the first domain, copy the data for the other domains underneath, without including the header row again. This way you'll have a continuous list of data from all the domains with just one header row (the first one). IMPORTANT NOTE: If you'll be analyzing a large number of backlinks (over 50k), enter only a limited number at start (10-20k), and add the rest (also in batches of 10-20k) after inserting the formula columns from the next step. This is necessary depending on your Excel version and your resources to avoid error warnings. Right, you should now have all the data imported into Excel. This is optional, but I find it much easier to work if this data is in a table. To do that, select all the data so far (click on one of the cells containing data, like A1, and hit CTRL-A), then transform it into a table (hit CTRL-L). Remember that without a table, you'll have to edit the formulas to include exact cell references (e.g. $A2 instead of [@URL]). Step 3: Apply the Necessary FormulasNow that we have all our data in Excel, we need to apply the formulas necessary for the next step. Our first two formulas will simply take the (source) URL and Target URL column data and strip everything but the subdomains. These nifty formulas are also part of the excellent "Excel for SEO" guide from Distilled. We'll need two create two new columns to hold this data. We'll name the first one "Source Subdomain", and the second one will be "Target Subdomain". Since we have a table, we just need to enter the names in the first two adjacent columns, and Excel will attach them to the table automatically. The first formula is Source Subdomain =MID([@URL],FIND("://",[@URL])+3,IFERROR(FIND("/",[@URL],9),LEN([@URL])+1)-(FIND("://", [@URL])+3)) (where [URL] is the column that contains the Source URL, might be named differently if you don't use OSE; thanks to GerardGallegos for pointing out a typo!) and the second formula is: Target Subdomain =MID([@[Target URL]],FIND("://",[@[Target URL]])+3,IFERROR(FIND("/",[@[Target URL]],9),LEN([@[Target URL]])+1)-(FIND("://",[@[Target URL]])+3)) (basically the same, just for the Target URL column). The formulas basically get and display what's after the "://" part and before the first "/" of the URLs (this allows it to also get links from and to secure locations with "https"). The IFERROR part ensures you get the right result for the case where the URL doesn't have an ending slash, like the homepage URL (OSE always adds this slash, but Majestic SEO doesn't). You just need to enter these inside the first cell of each of the columns, and Excel will auto-populate them for the whole column. IMPORTANT NOTE: If you selected the "pages to subdomain" instead of "to root domain" option when getting your data, you won't need to include the next two formulas, since you only have one subdomain for each site (e.g. www.seomoz.org for Moz, seogadget.co.uk for SEO Gadget, etc.). If that's the case, skip to the Unique Domains formula. Now, you might be wondering on the fact that we only got the subdomain of the Target URL, and that's an actual issue. This means that seomoz.org and www.seomoz.org will be counted as different sites, which may be a problem further down the line (you would see domains that link to 4 or more competitors, even if you only have 3 competitors in your data). To fix this, we need to pull the actual root domain from the subdomain. Unfortunately this will be a tad complicated since we have to differentiate between TLDs (Top-Level Domains) and SLDs (Second-Level Domains), because one of our competitors is on a SLD (SEO Gadget), and we don't want to end up with the domain "co.uk" instead of "seogadget.co.uk" (so you can't use the "just grab whatever is after the last dot as TLD" routine). IMPORTANT NOTE: If you have the SeoTools for Excel plugin by Niels Bosma, you can skip the TLD and Target Root Domain formulas, and use just one formula to get the root domain. In this case the formula would be =UrlProperty([@[Target Subdomain]]; “domainâ€). However, if you intend to use your own custom SLDs (e.g. "blogspot.com" to avoid clumping different blogs from the same domain together), you'll need to use the functions below. Thanks to Roald for reminding me of this function! First, we need to list all the TLDs and SLDs we expect to encounter in the Target URL column somewhere separated from the table. I chose the Z column for this. Our list will be the following: .com Always place the SLDs under the TLDs (as a point of principle), so they get detected last. Think of it like a set of rules, the formula will check for all rules and return the last match it found. So for example, if one of your competitors is a blog hosted on ".blogspot.com" (which is not really a SLD, but you would consider it as such for your analysis, since you're not interested in "blogspot.com" as a competitor), you would want to place that under the ".com" TLD so it gets matched correctly. With the list set in place, our next formula will retrieve the TLD/SLD (I will just refer to them as TLD from now on) from the Target Subdomain column. Use it in the next adjacent column to the table, and name the column "TLD". The formula is: TLD =LOOKUP(2^15,SEARCH($Z$1:$Z$4,[@[Target Subdomain]]),$Z$1:$Z$4) The 2^15 value inside the LOOKUP tells the formula to always look for the last occurrence of the TLD in the Target Subdomain. If you're curious in what case would this be useful, imagine the subdomain "test.comparison.org". You would want to retrieve the ".org" part, as that is clearly the TLD. However, without the 2^15 part, Excel would first encounter ".comparison" and stop, so it would then match it to ".com", which would be a mistake. The $Z$1:$Z$4 range references the cells that contain the TLDs. Now that we have the TLD, let's get the actual root domain. To do this, we basically get the Target Subdomain, strip the TLD, get everything that's after the last dot, and then apply the TLD back on it. That means that if we have "some.thing.example.com", we'll strip the TLD and get "some.thing.example", retrieve everything after the last dot which gets us "example", then finally apply the TLD to get the root domain "example.com". All of the above is done in one formula, which you'll place in the next column to be named "Target Root Domain": Target Root Domain =IFERROR(RIGHT([@[Target Subdomain]],LEN([@[Target Subdomain]])-FIND("|",SUBSTITUTE(LEFT([@[Target Subdomain]],LEN([@[Target Subdomain]])-LEN([@TLD])),".","|",LEN(LEFT([@[Target Subdomain]],LEN([@[Target Subdomain]])-LEN([@TLD])))-LEN(SUBSTITUTE(LEFT([@[Target Subdomain]],LEN([@[Target Subdomain]])-LEN([@TLD])),".",""))))),[@[Target Subdomain]]) Yeah, bit of a long one, I know. I wanted however to get it inside one formula to avoid creating unnecessary columns and get the root domain in one go. The IFERROR portion at the beginning is for the case where the Target Subdomain is actually the Root Domain, so it just returns that instead. The rest of the formula does exactly what I described above. We now have our root domains! The fifth (or third, depending if you used the last two) formula has the purpose to check if a source domain links to a target one at least once, so you can later see how many of your competitors get links from that source. In the pivot table that we build in the next step, the formula will have the role of doing somewhat of a "distinct count" of target root domains for each source URL. Unfortunately, there is no way to do this without the formula unless you are using Excel 2013. I'm saying this because, in order to create this "distinct count", we can actually use one of three formulas. Two of them might be faster than the third, but you also might get error warnings from Excel (at least the 2010 32 bit version I'm using) on large amount of links (like 30k+). I've decided to use the third formula which, albeit it might be slower, seems to work fine with a lot of links and yield the same result. Create a new adjacent column called "Unique Domains", and add the following formula: Unique Domains =IF(COUNTIFS(INDIRECT(ADDRESS(ROW(Table2[#Headers])+1,COLUMN([Source Subdomain]))&":"&ADDRESS(ROW([@[Source Subdomain]]),COLUMN([Source Subdomain]))), [@[Source Subdomain]],INDIRECT(ADDRESS(ROW(Table2[#Headers])+1,COLUMN([Target Root Domain]))&":"&ADDRESS(ROW([@[Target Root Domain]]),COLUMN([Target Root Domain]))), [@[Target Root Domain]])=1,1,0) The COUNTIFS function counts how many times a Source Subdomain has the same Target Root Domain associated with it. The IF identifies the first association of this kind and returns the value 1 for it and the value 0 for subsequent associations (kind of like saying "Yes, this source links to this target at least once"). The formula might seem long, but it's actually equivalent to this: =IF(COUNTIFS($O$2:$O2,$O2,$R$2:$R2,$R2)=1,1,0) In this case, the O column is the Source Subdomain, while the R column is the Target Root Domain. 2 is the row number where you first introduce the formula (the row right beneath the header row). I chose the longer version so it can be applied without identifying the columns and rows needed to make it work. This is why I used the INDIRECT and ADDRESS functions, which have the purpose of automatically identifying the necessary references for the formula, regardless of where the table is positioned or how many columns it has. Remember, if you haven't used the TLD/Root Domain formulas, you will use the Target Subdomain reference instead of the Target Root Domain. Unfortunately, the COUNTIFS function won't work for Excel 2003, so you need to use a different formula for this issue, which you can find here (the SUMPRODUCT version). The final formula is rather simple, where we need to check if the link points to us (our primary domain) or not, so we can later filter it. Create an adjacent column named "Link To Us", and enter the following formula (where you replace the "seomoz.org" with your root domain): Link To Us =IF([@[Target Root Domain]]="seomoz.org",1,0) The formula is a basic if conditional, which returns 1 if it's our primary root domain, 0 if it's a competitor. Remember, if you haven't used the TLD/Root Domain formulas, then you're gonna use Target Subdomain instead of the Target Root Domain (in which case, for this example, you would have [@[Target Subdomain]]="www.seomoz.org"). Step 4: Build the Pivot TableOkay, now that we have our backlink data table set up, the last two steps will be quite simple. Create a new sheet (or rename one of the other default ones) named "Pivot Table". It is here where the data visualization will occur, and where you will be spending the time to analyze it. So let's create our pivot table. The process goes something like this: Click the Insert tab -> click the Pivot Table button -> enter the name of our table containing backlink data (usually Table1, unless you renamed it or created multiple tables) -> hit OK. You will now have an empty pivot table with a Field List sidebar. Here's how we configure it:
The field configuration should look like this (might differ somewhat depending on your backlink data provider and the metrics you use): Next, since the data is expanded and we can't really see anything, we need to collapse it under the Source Subdomain fields. To do that, click one of the source subdomains in the pivot table -> make sure you're in the Options tab menu of the Pivot Table -> click Collapse Entire Field. You can repeat the collapse process for a Target Root Domain as well. Step 5: Sort It Out and You're DoneNow that we have everything we need inside the pivot table, we only need to sort the data. First of all, since we're trying to get competitor links, we need to filter out the Source Subdomains that already link to us. To do this, click on the Row Labels dropdown -> Value Filters -> Equals... -> in the new window that opens select "Sum of Link To Us" and enter "0" in the value field -> hit OK. Basically, you want to see the sites that link to most of your competitors, since, as I mentioned at the beginning of this guide, these are the sites most likely to link to you as well. To sort it, click the Row Labels dropdown again -> More Sort Options -> choose Descending (Z to A) by -> choose Sum of Unique Domains -> hit OK. There, we now have a pivot table with domains that link to our competitors but not us, sorted by the amount of competitors they link to. You can of course sort it by Domain Authority (or any other metric you chose to include). I've yet to find a proper way to sort by multiple columns (as in sort by Sum of Unique Domains first, then by Domain Authority). The final version looks something like this: IMPORTANT NOTE: Before saving the file, to reduce the time it takes to open it as well as reducing its size, we can replace all the formulas with their value so Excel won't recalculate them. This is done by selecting all table data (CTRL-A) -> copying it (CTRL-C) -> then pasting just the values (Paste Values). Future ImprovementsThere are a few things I had in mind that could be added to this tool:
If you have any idea on how any of these can be implemented, write it in a comment below. Template and InstructionsAs I promised, I'll include a template that contains all the necessary formulas and the pivot table, to which you only need to add your backlink data. I've decided to create two separate files:
If you have any problems with the files or there's anything that you have trouble understanding, please let me know in a comment below. Enjoy my carefully crafted meme: Editor's note: this post is available in Romanian on the author's own site at http://www.vertify.ro/analiza-link-urilor-competitiei-link-intersect-in-excel/ Sign up for The Moz Top 10, a semimonthly mailer updating you on the top ten hottest pieces of SEO news, tips, and rad links uncovered by the Moz team. Think of it as your exclusive digest of stuff you don't have time to hunt down but want to read! |


| You are subscribed to email updates from Moz Blog To stop receiving these emails, you may unsubscribe now. | Email delivery powered by Google |
| Google Inc., 20 West Kinzie, Chicago IL USA 60610 | |


Niciun comentariu:
Trimiteți un comentariu